Lumagrid
Themeable, pluggable data widgets for React
What it is
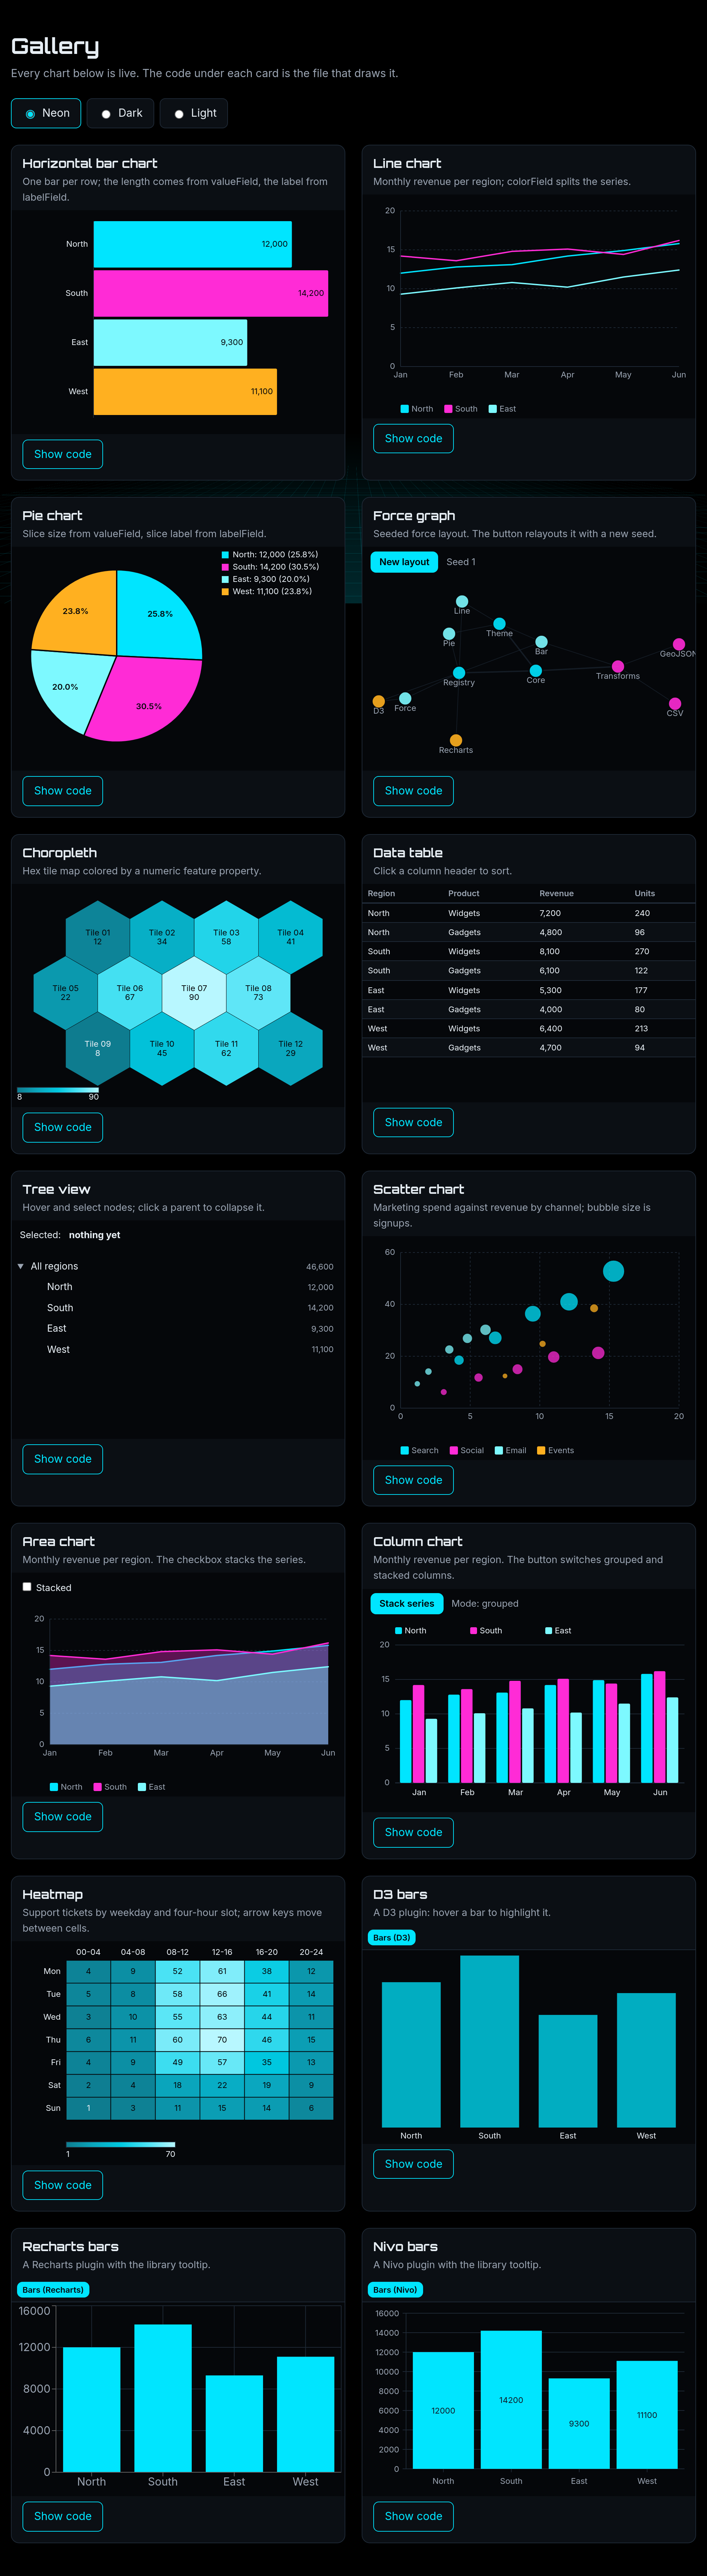
Lumagrid is a layered React + TypeScript library for data visualization widgets over tabular, hierarchical, geographic and time-series data. Draw with the built-in SVG charts, or plug in your own renderer.
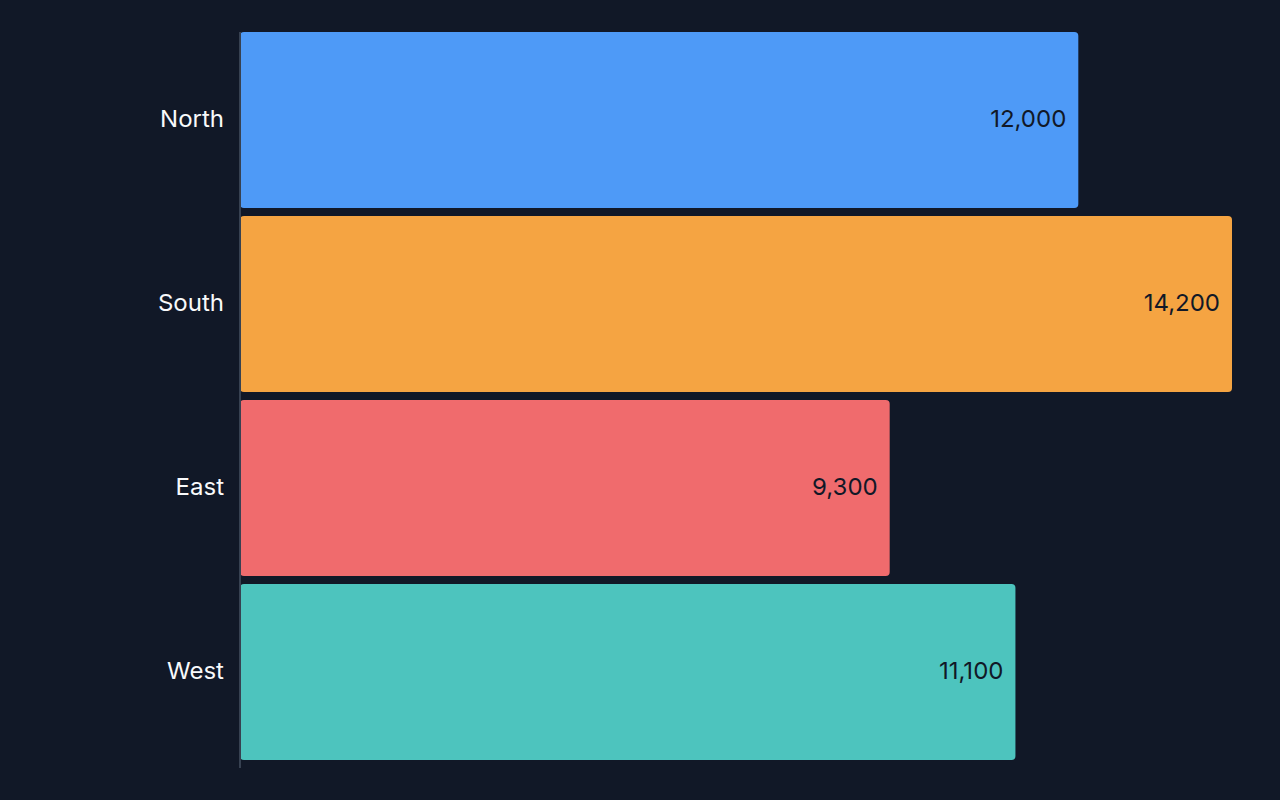
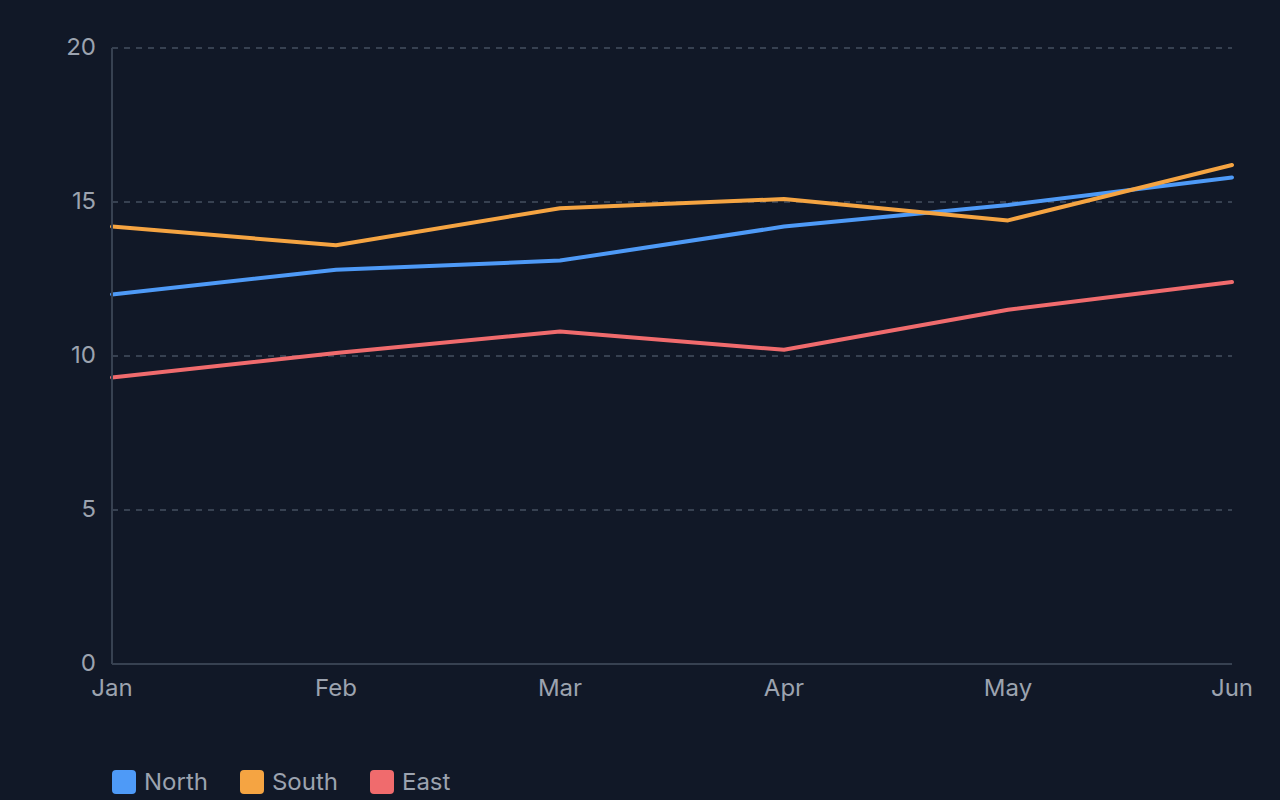
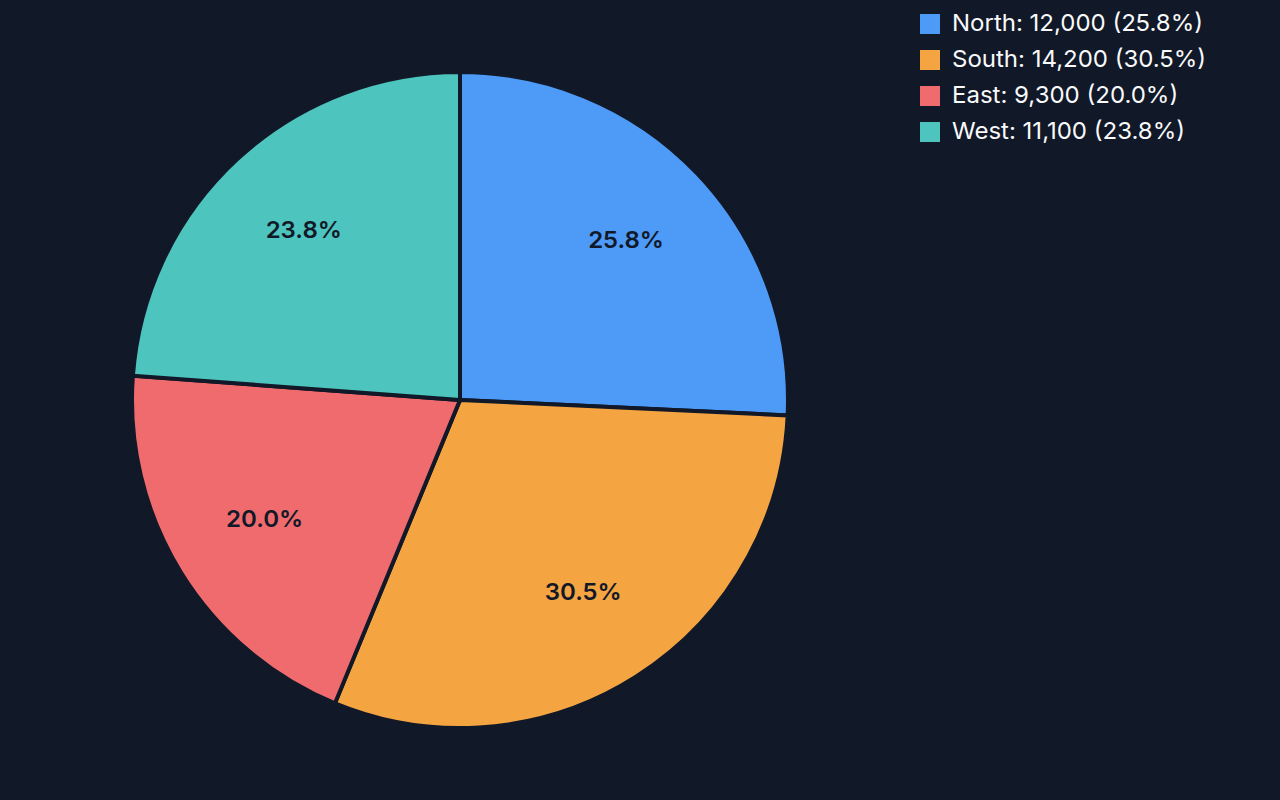
- Eleven native chart types: bar, line, pie, scatter, area, column, heatmap, data table, tree view, choropleth and force graph
- D3, Recharts and Nivo adapters that turn any of those libraries into a view
- A transform layer (
flatten,aggregate,pivot,groupBy,geoNormalize) with no React dependency - Light and dark themes, plus your own through
ThemeProvider - The
ChartPlugincontract for writing a renderer from scratch, and a conformance kit (lumagrid/testing) that checks it - Strict TypeScript types, with every export tagged
@publicor@experimental
Install
npm install lumagrid react react-dom
# optional adapter peers, only for the libraries you use
npm install d3 recharts @nivo/bar
Note: Lumagrid is pre-1.0. Minor versions may change the API until 1.0; see docs/STABILITY.md and docs/RELEASE-PLAN.md.
Quickstart
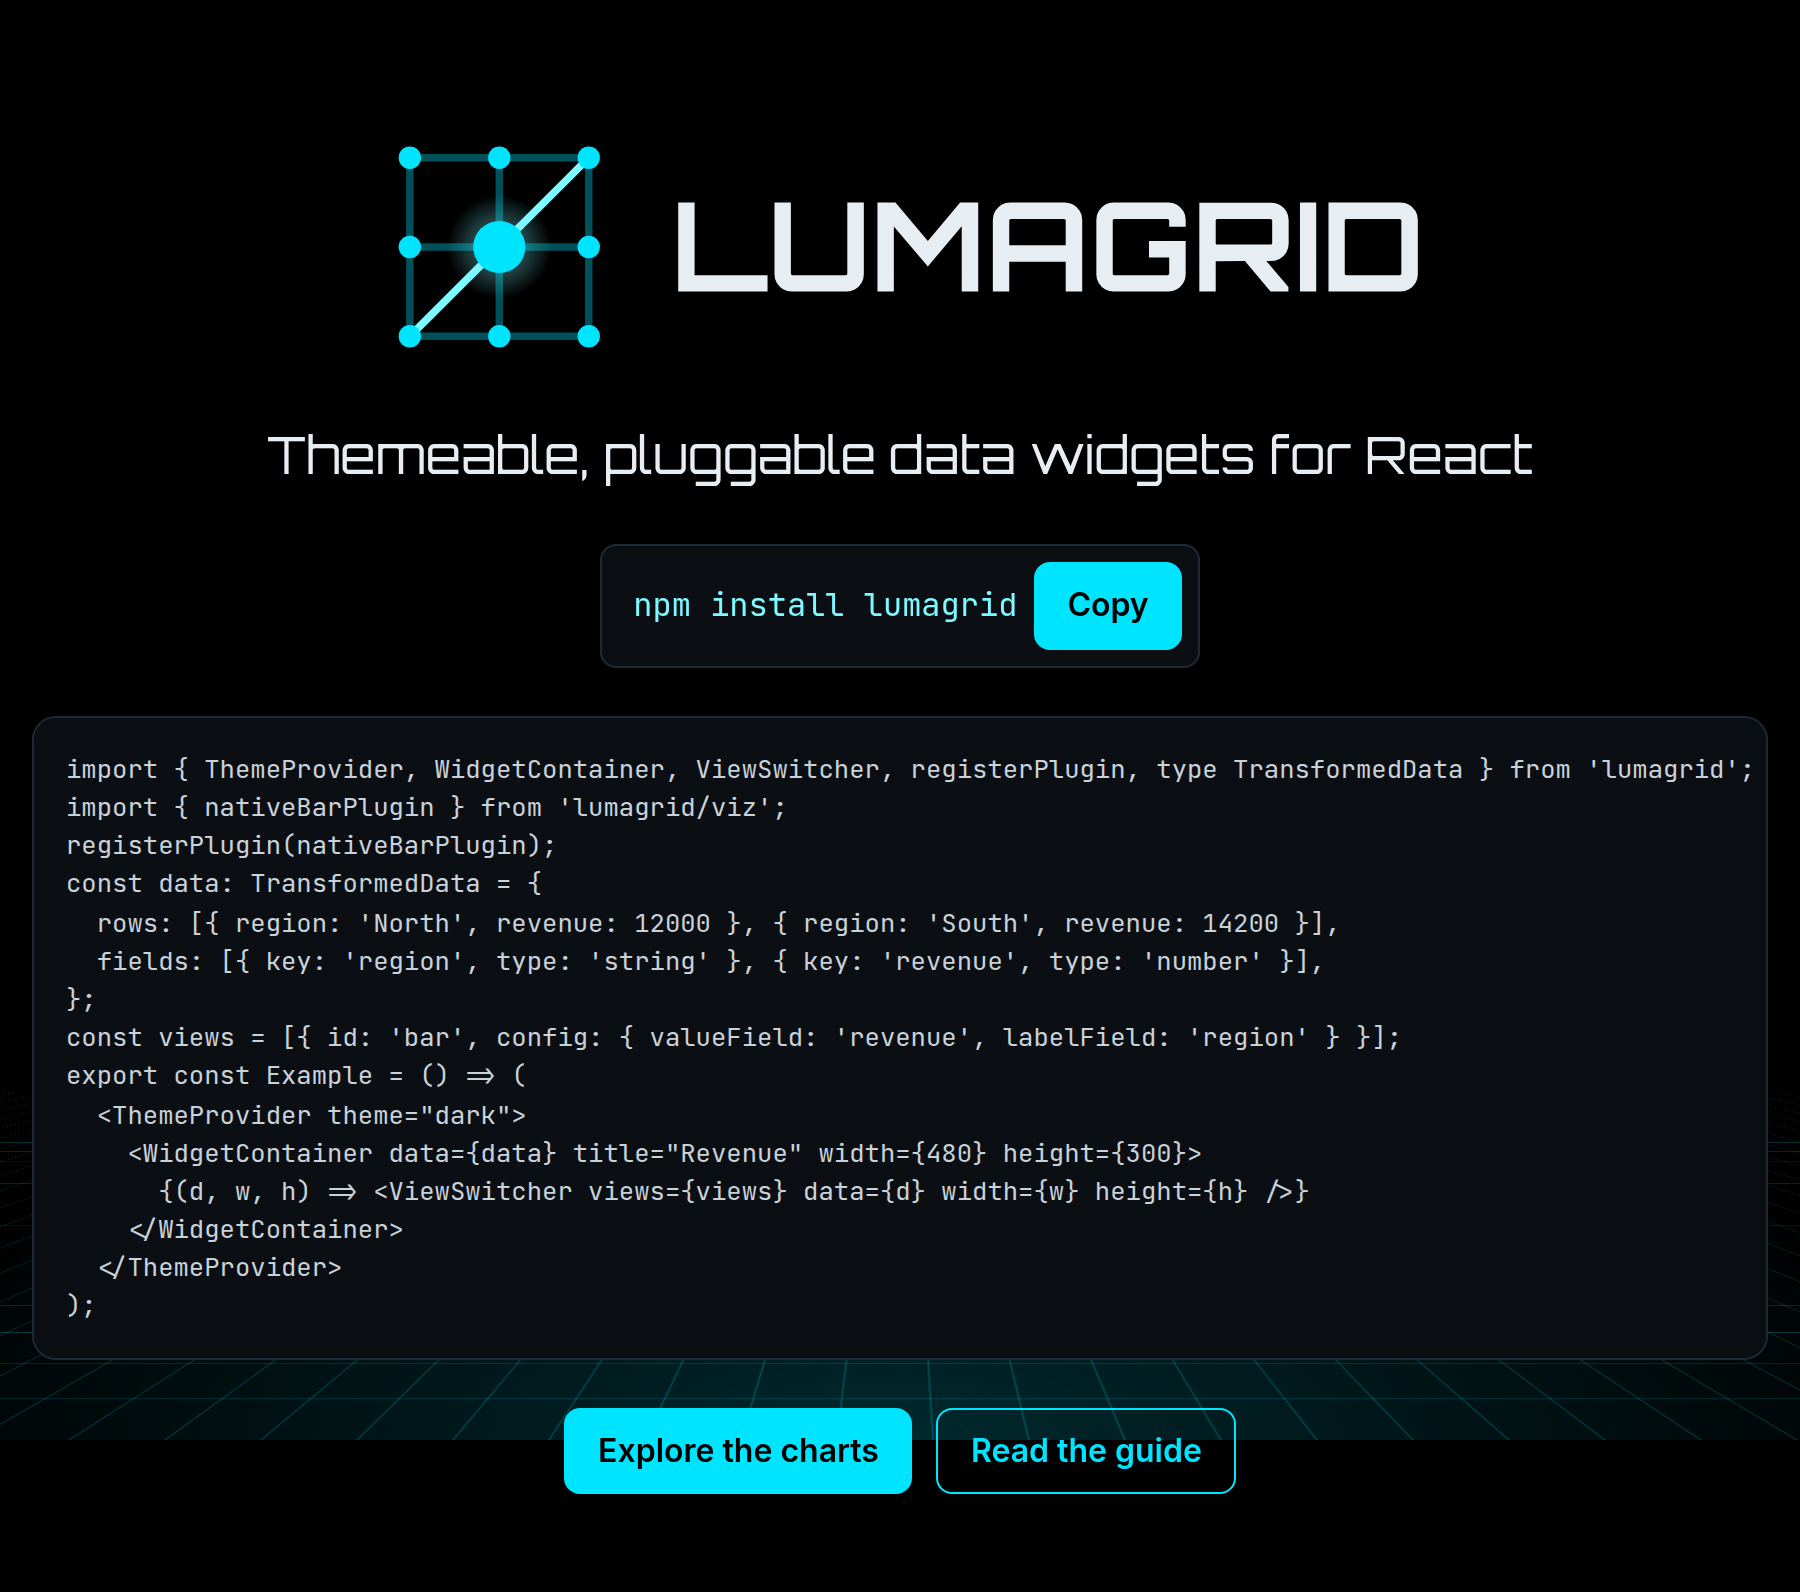
import { ThemeProvider, WidgetContainer, ViewSwitcher, registerPlugin, type TransformedData } from 'lumagrid';
import { nativeBarPlugin } from 'lumagrid/viz';
registerPlugin(nativeBarPlugin);
const data: TransformedData = {
rows: [{ region: 'North', revenue: 12000 }, { region: 'South', revenue: 14200 }],
fields: [{ key: 'region', type: 'string' }, { key: 'revenue', type: 'number' }],
};
const views = [{ id: 'bar', config: { valueField: 'revenue', labelField: 'region' } }];
export const Example = () => (
<ThemeProvider theme="dark">
<WidgetContainer data={data} title="Revenue" width={480} height={300}>
{(d, w, h) => <ViewSwitcher views={views} data={d} width={w} height={h} />}
</WidgetContainer>
</ThemeProvider>
);
Charts
 Bar |
 Line |
 Pie |
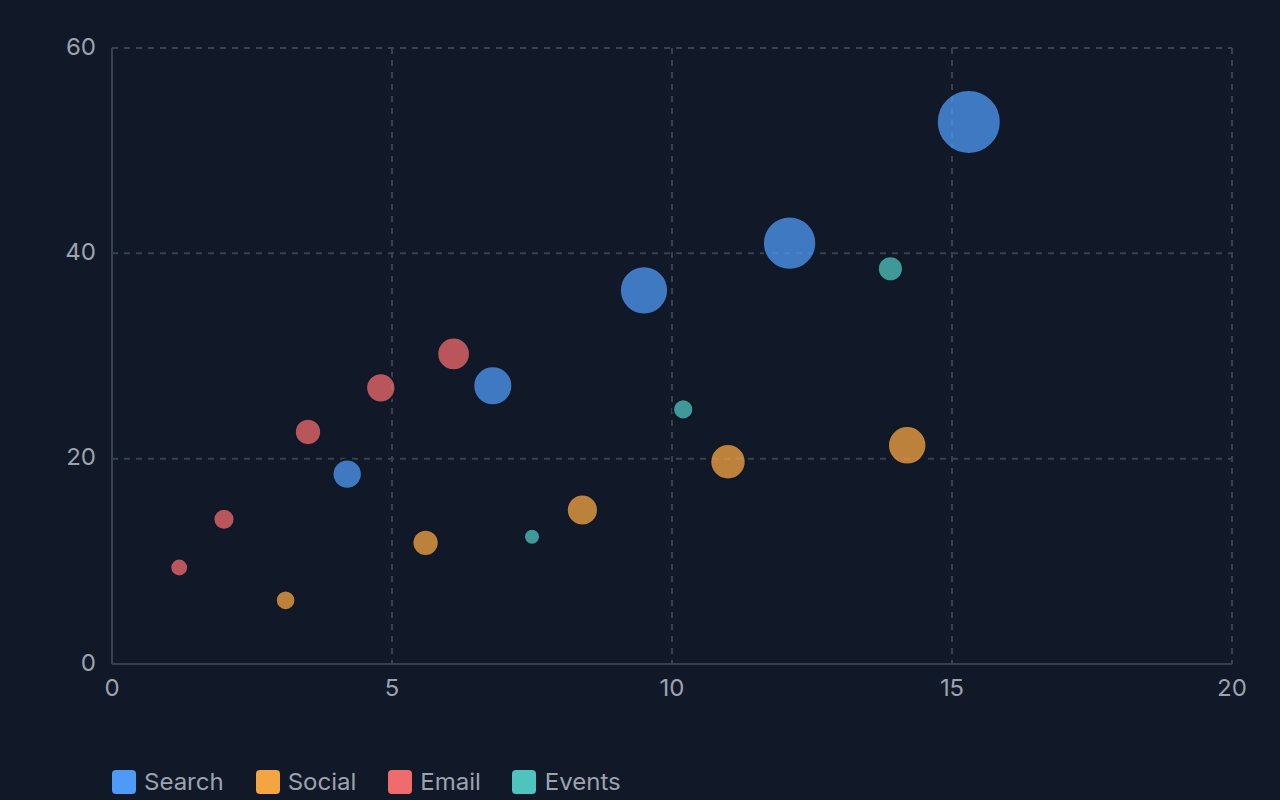 Scatter |
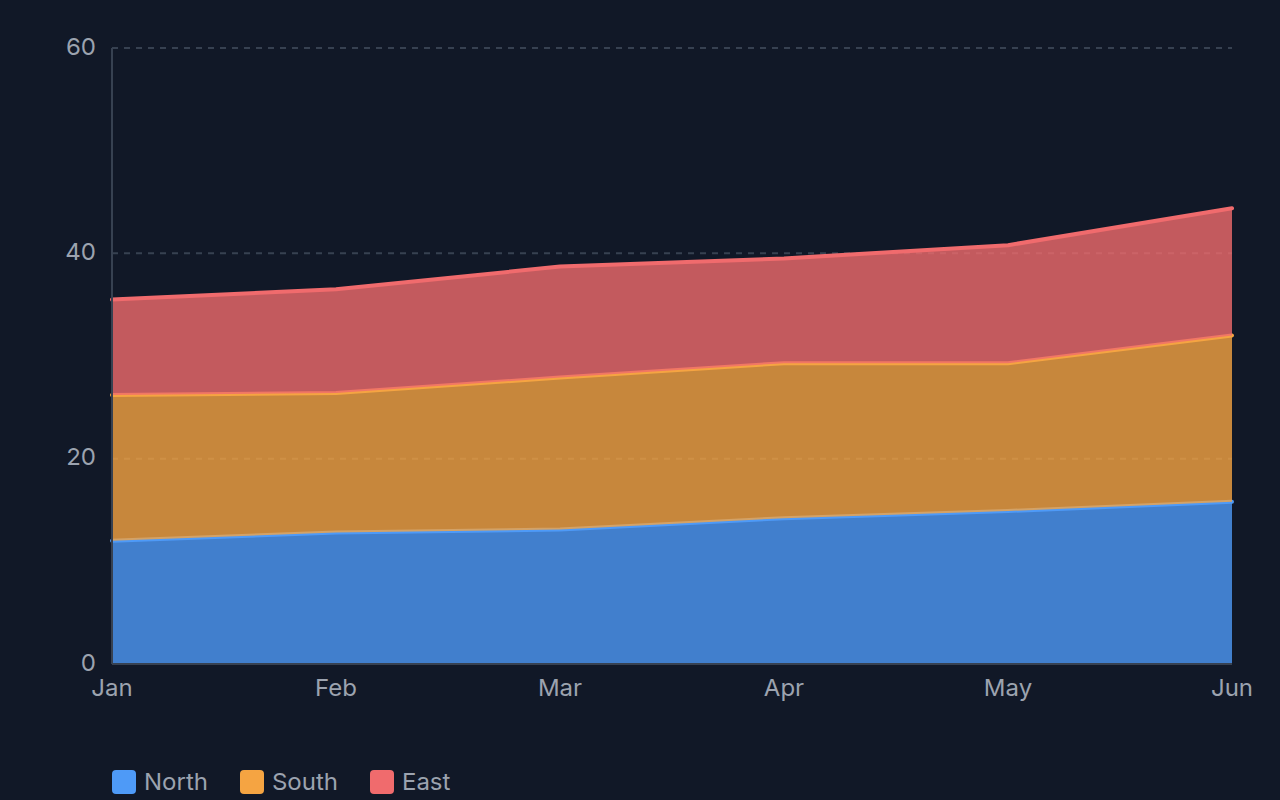 Area |
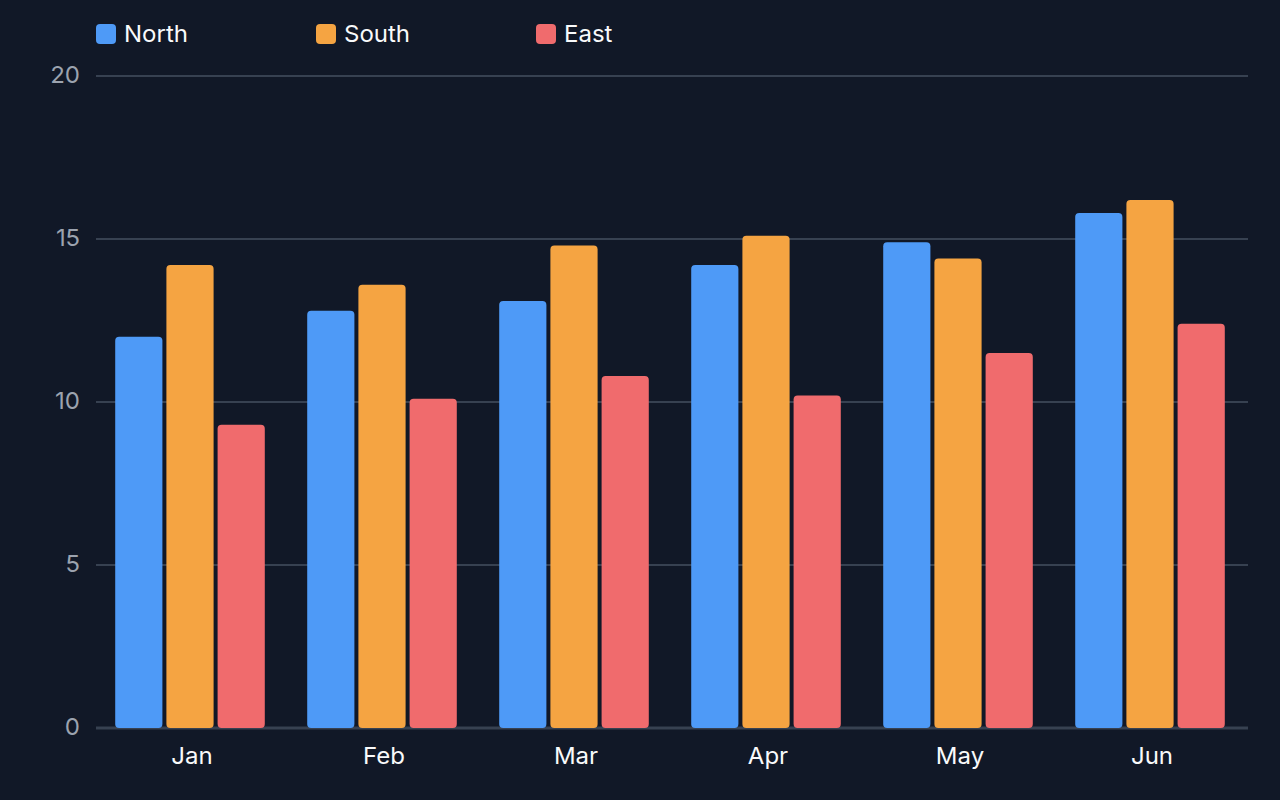 Column |
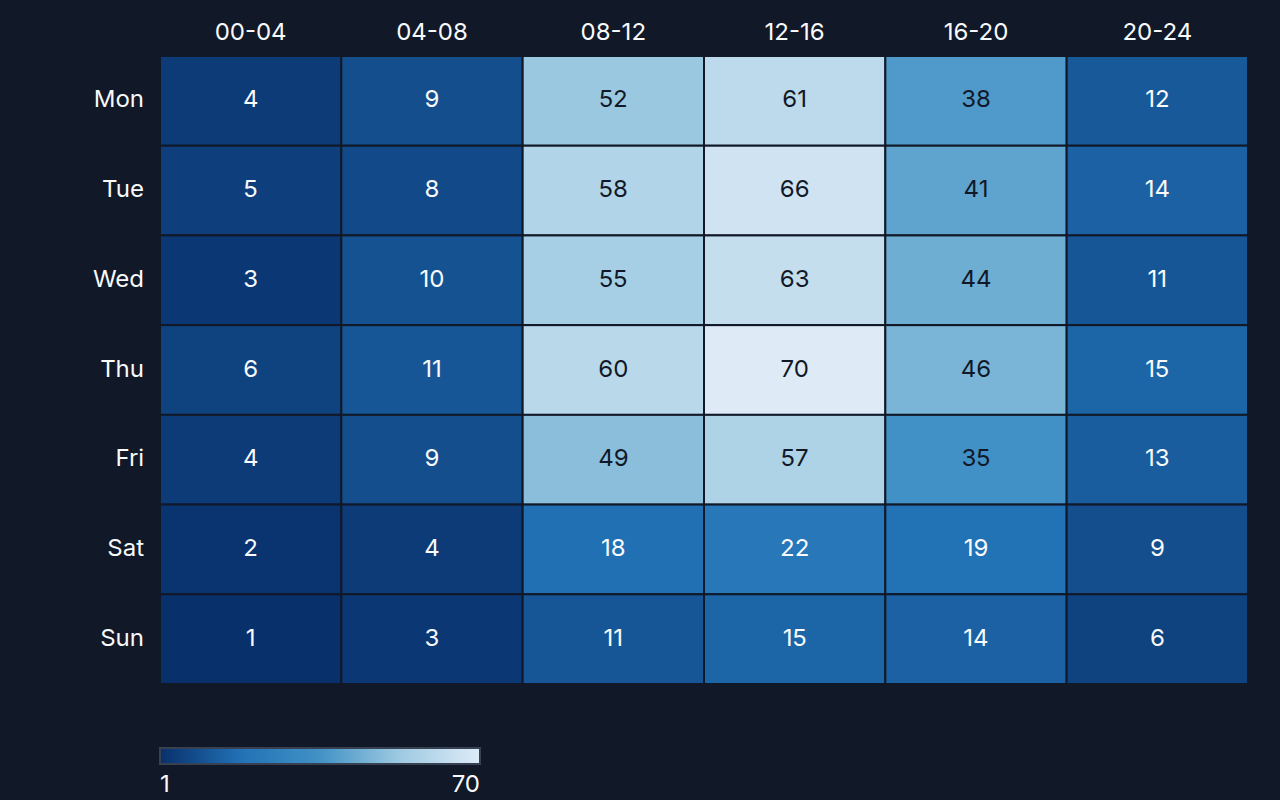 Heatmap |
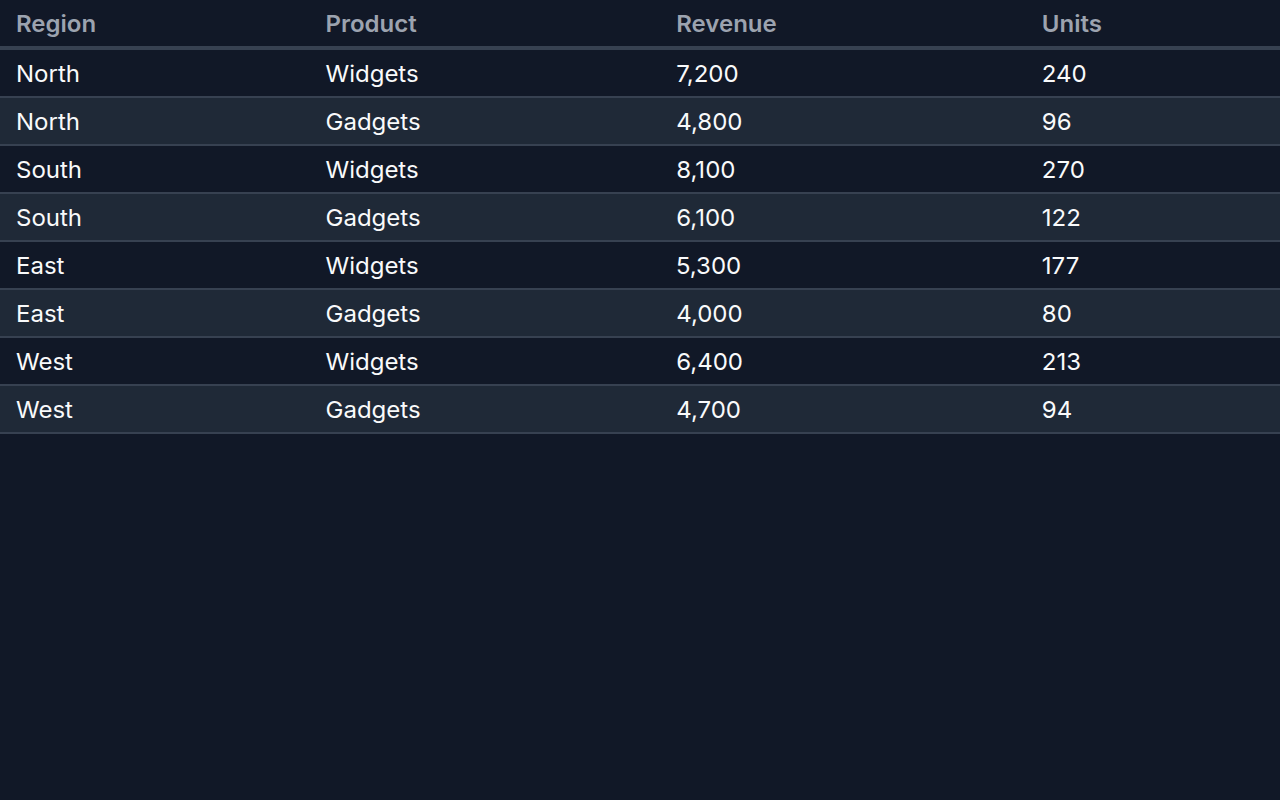 Data table |
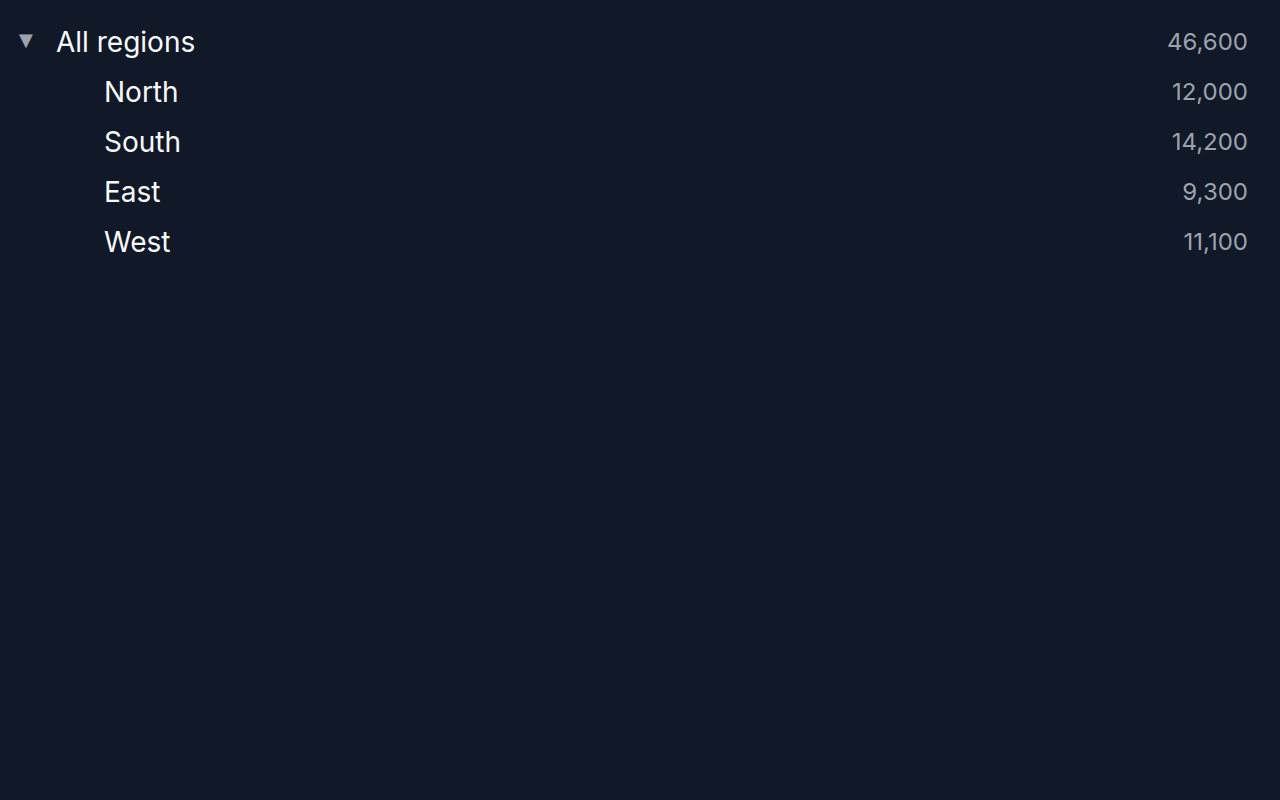 Tree view |
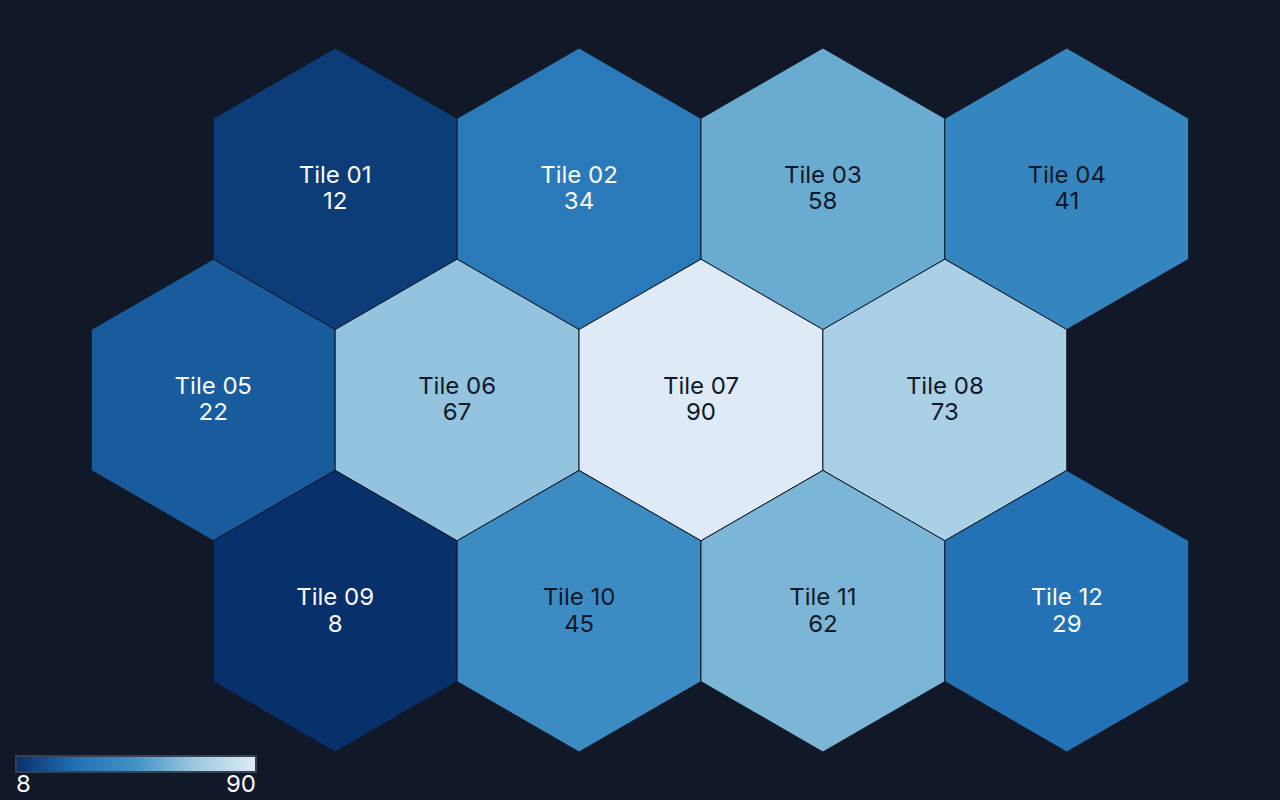 Choropleth |
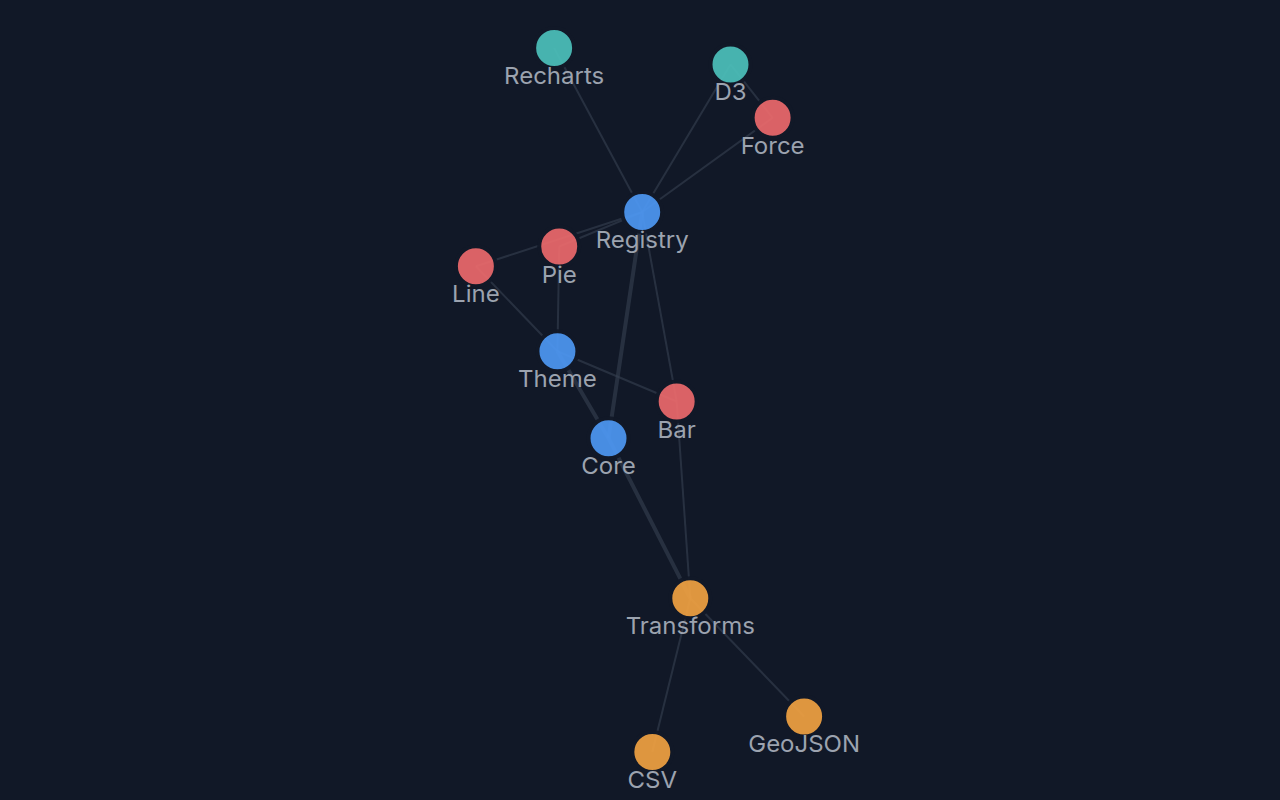 Force graph |
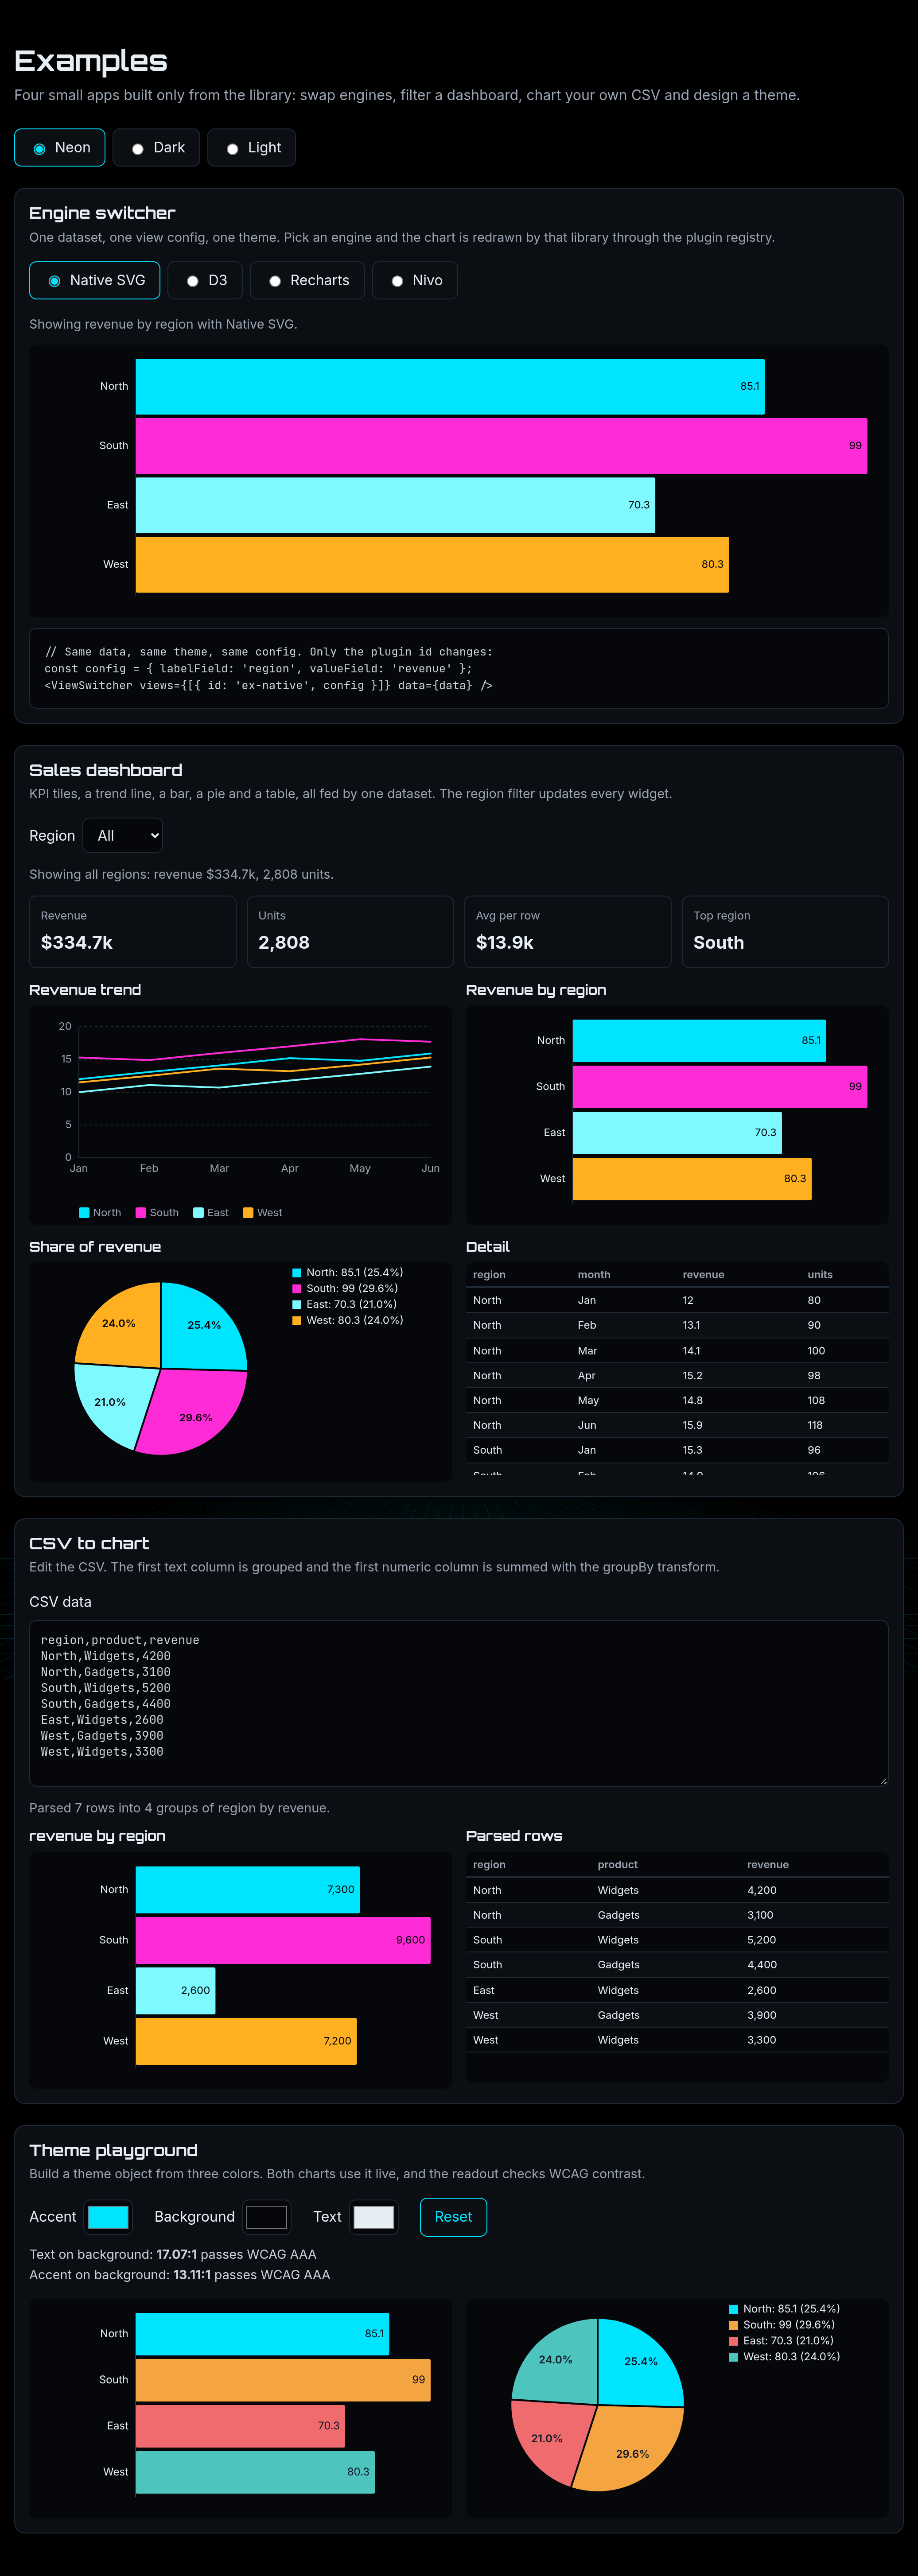
See the live Examples (dashboard, CSV to chart, engine switcher, theme playground) and the gallery.
Why Lumagrid
Lumagrid is not trying to out-chart anyone. Its angle is the seam: a chart is a plugin, so you can swap the engine under a view and prove a new engine behaves.
| Lumagrid | Recharts | Nivo | Raw D3 | |
|---|---|---|---|---|
| Engine-swappable plugins | Yes: one ChartPlugin contract; native, D3, Recharts and Nivo renderers all plug in |
No: it is the engine | No: it is the engine | No: it is the engine |
| Conformance kit | Yes: lumagrid/testing, 8 checks you can run on your own plugin |
No | No | No |
| Built-in keyboard and screen-reader support | Every native chart has an accessible name, and the interactive ones are keyboard navigable; checked by the kit | Partial (keyboard layer, labels mostly up to you) | Partial (varies by chart, mostly up to you) | None: you build it |
| Number of charts | 11 native, plus anything you wrap | Far more, with many options per chart | Far more, a large catalog | Unlimited, but you write each one |
| Maturity | Pre-1.0 (0.x), new, small community | Mature, widely used, large community | Mature, widely used | The reference standard |
Be honest about the trade: Recharts, Nivo and D3 have far more chart types, richer options, much larger communities and years of production use. Lumagrid has 11 charts and is pre-release. Pick it when you want one theme, one data shape and one plugin contract across several engines, or when you need to check that a custom renderer meets an accessibility baseline. If one engine already covers your charts, use that engine.
Next: the bring your own engine guide builds a plugin from scratch and runs it through the conformance kit, and the live Examples show the engines switching on one dataset.
Screenshots
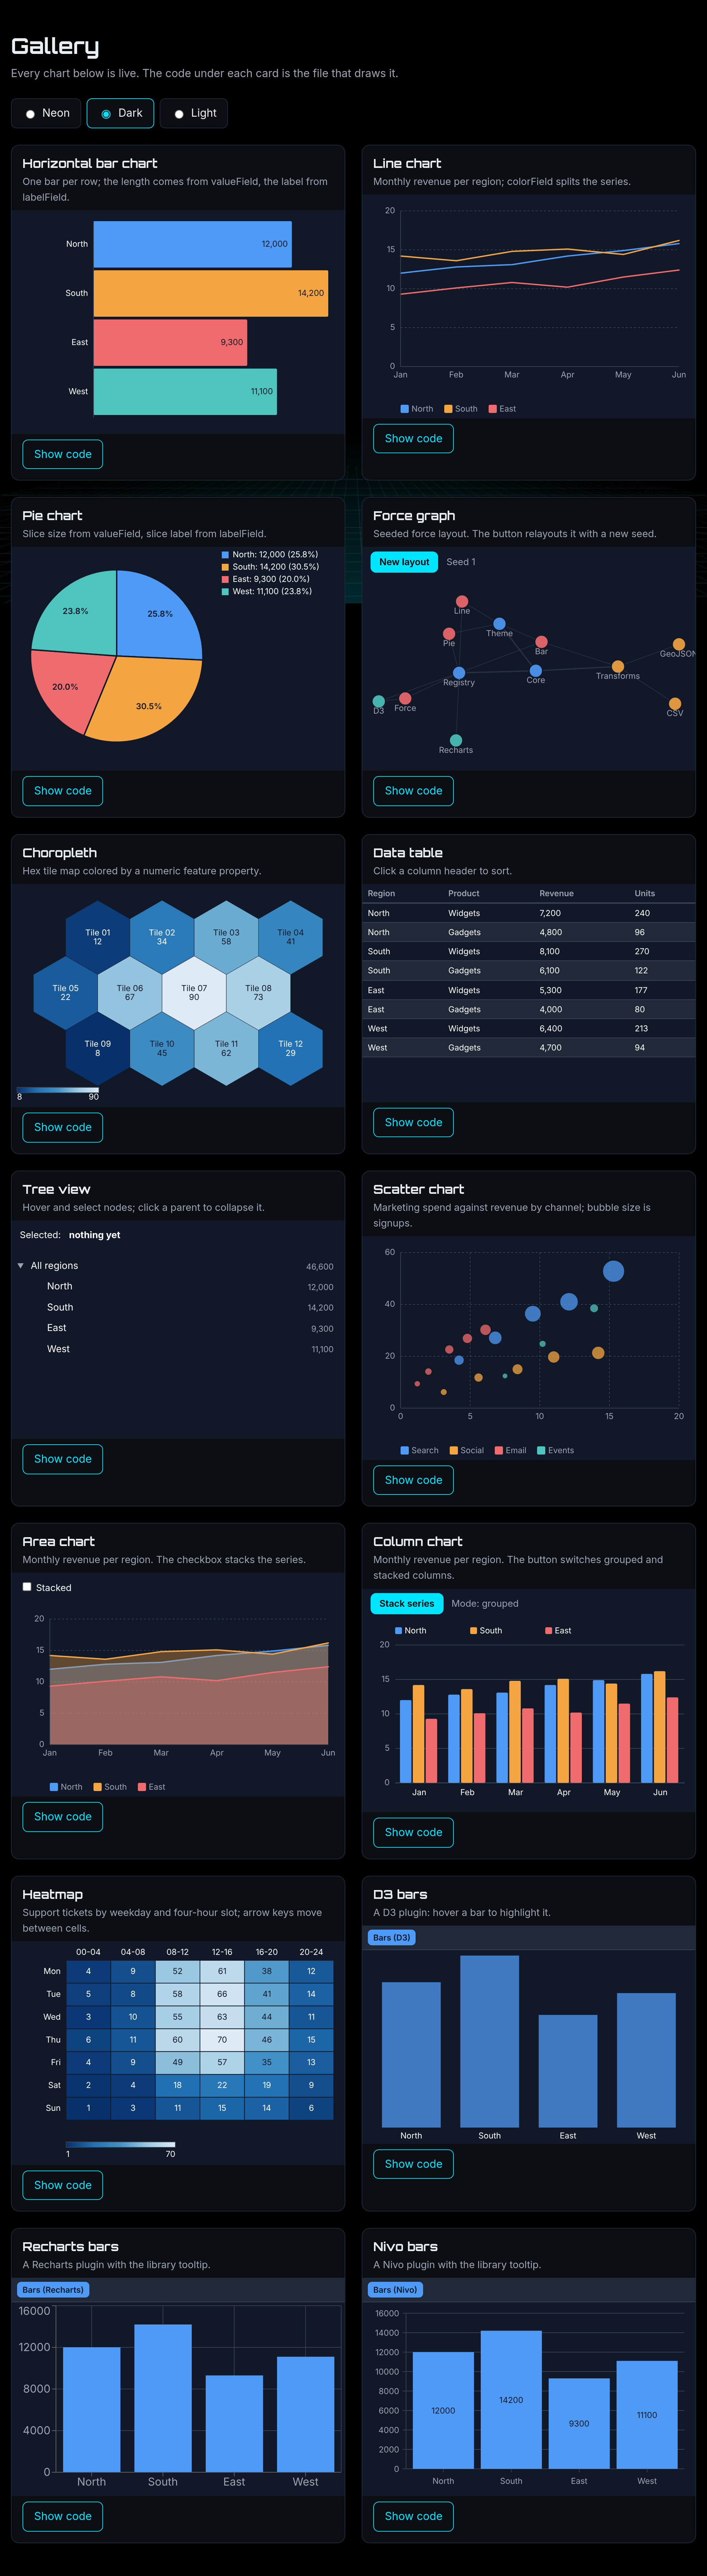
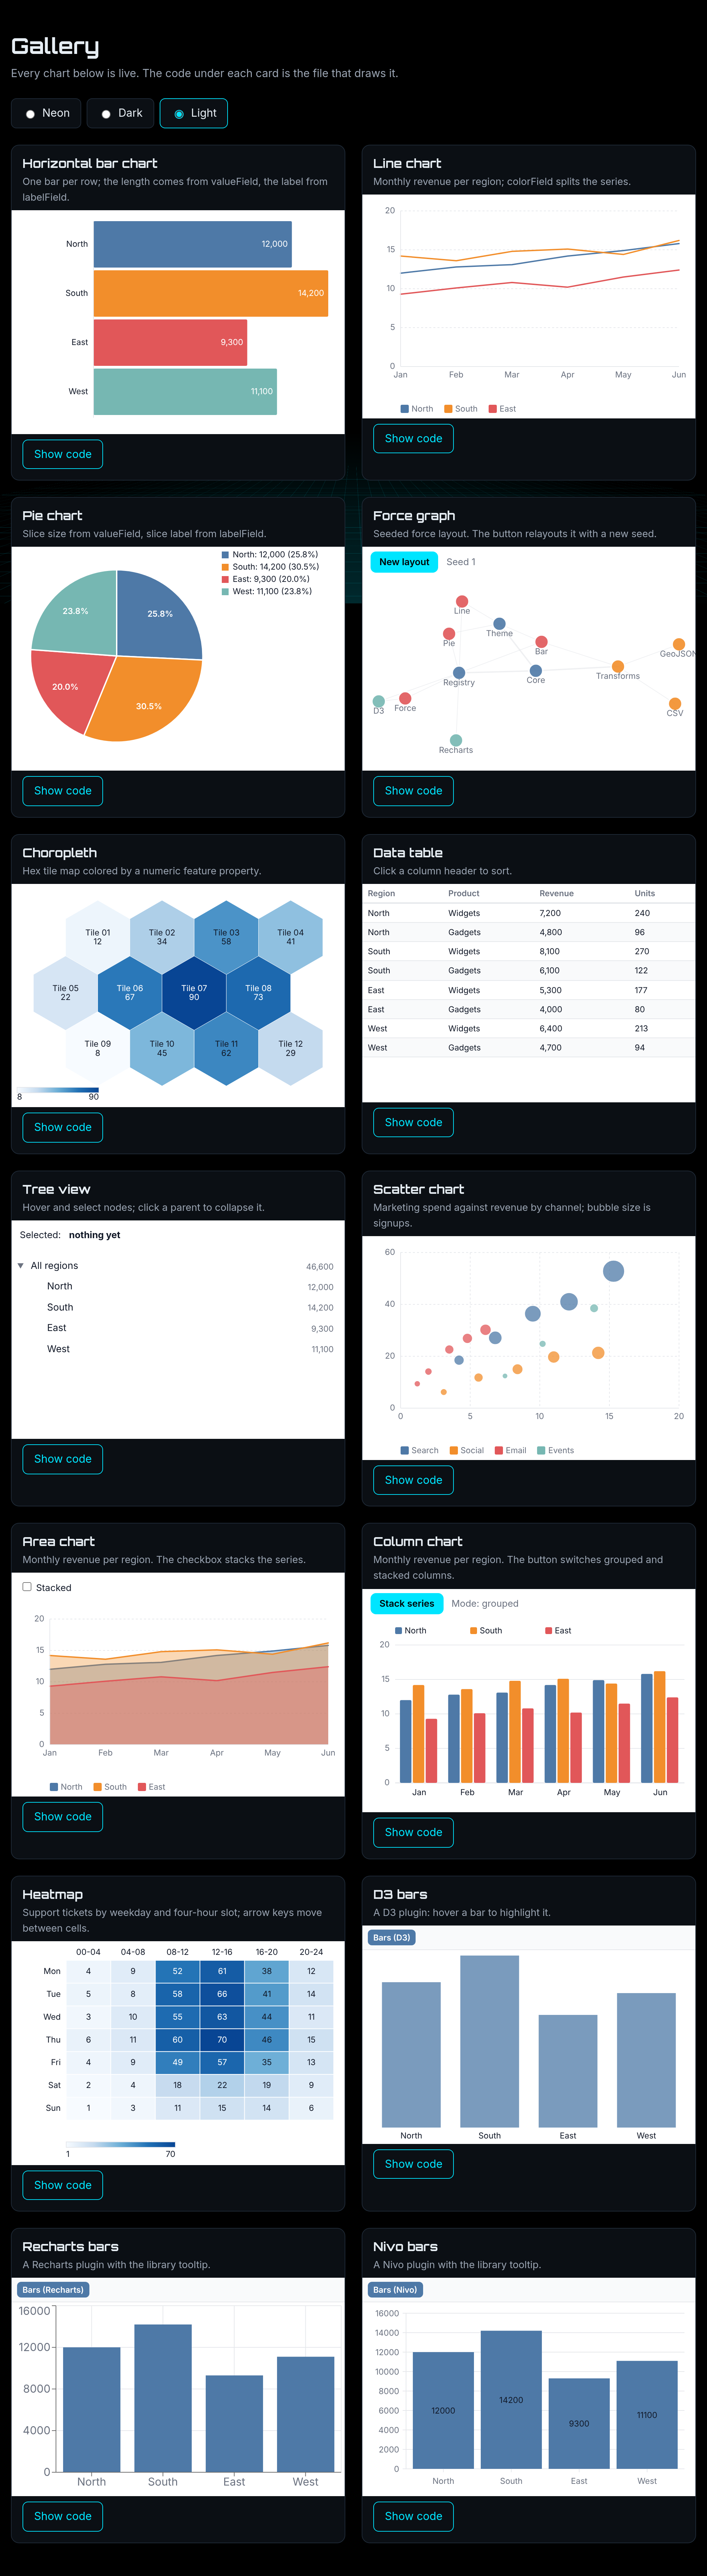
The live gallery switches between the Neon, Dark and Light themes.
| Neon | Dark | Light |
|---|---|---|
 |
 |
 |
How it fits together
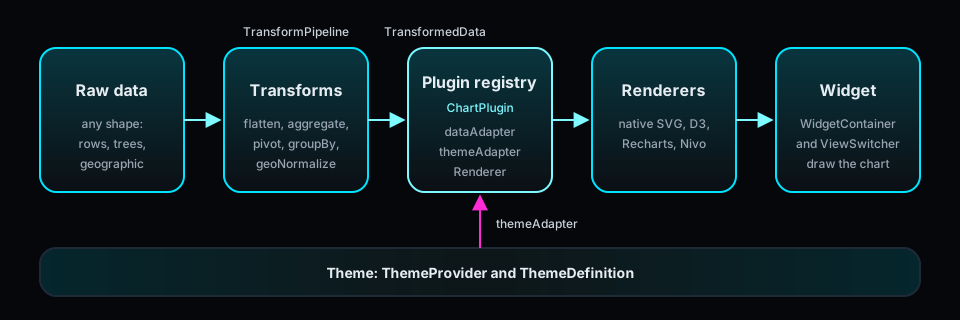
Data flows through the transform layer, a plugin turns it into a renderer's shape, and the theme layer styles the result. Each layer imports only from the layers below it.
Learn more
| Showcase site | https://bsommers.github.io/lumagrid/ |
| User guide | docs/guide/README.md |
| Bring your own engine | docs/guide/bring-your-own-engine.md |
| Live examples | https://bsommers.github.io/lumagrid/#examples |
| API reference | https://bsommers.github.io/lumagrid/api/ |
| Architecture | docs/ARCHITECTURE.md |
| Using and configuring | docs/USING.md |
| Purpose | docs/PURPOSE.md |
| Stability | docs/STABILITY.md |
| Changelog | CHANGELOG.md |
| Contributing | CONTRIBUTING.md |
Source: https://github.com/bsommers/lumagrid
Stability
The public API is being frozen for 1.0. The tag policy and the stable and experimental lists are in docs/STABILITY.md.